

CD-FC-01
Project
Democratic Republic of CongoForest Carbon Removal
Forest carbon
- PEM GHG-UMO.1
- 2001–2025
- 35.9M tCO2e
- 91,663 hectares
Issuance
Twenty-five years of issued removals.
Removals, not avoided emissions. Every vintage this programme has issued follows from that year's measurement rather than from a schedule set at design. The record below is complete and unsmoothed: twenty-five years, no modelled years, and the variation you would expect from a forest that grows faster in some years than others.
| Vintage year | Issued removals, tCO2e | Against the 2001 to 2023 mean |
|---|---|---|
| 2001 | 1,127,454 | -24 per cent |
| 2002 | 1,374,945 | -8 per cent |
| 2003 | 1,572,937 | +5 per cent |
| 2004 | 1,724,181 | +16 per cent |
| 2005 | 1,456,525 | -2 per cent |
| 2006 | 1,638,934 | +10 per cent |
| 2007 | 1,495,940 | 0 per cent |
| 2008 | 1,587,603 | +6 per cent |
| 2009 | 1,839,676 | +23 per cent |
| 2010 | 1,614,185 | +8 per cent |
| 2011 | 1,440,025 | -3 per cent |
| 2012 | 1,401,527 | -6 per cent |
| 2013 | 1,962,504 | +32 per cent |
| 2014 | 1,568,353 | +5 per cent |
| 2015 | 1,704,015 | +14 per cent |
| 2016 | 1,171,453 | -21 per cent |
| 2017 | 1,393,277 | -7 per cent |
| 2018 | 1,285,115 | -14 per cent |
| 2019 | 1,250,283 | -16 per cent |
| 2020 | 1,360,278 | -9 per cent |
| 2021 | 1,264,032 | -15 per cent |
| 2022 | 1,350,195 | -9 per cent |
| 2023 | 1,721,431 | +15 per cent |
| 2024 | 700,305 | -53 per cent |
| 2025 | 921,213 | -38 per cent |
- Twenty-five vintages
- Every year measured. None modelled, none interpolated.
- Detected the same year
- A five-year verification cycle would not have examined 2024 until 2025, by which time the vintage had been issued.
- Recovering
- 2025 issuance is around a third above 2024 and the record will show where it settles.
The shaded band is the mean of 2001 to 2023 with one standard deviation either side. It is shown because an annual figure is only interpretable against the years around it. A project crediting against a modelled baseline would have issued at close to that band throughout the period, since a baseline is fixed at design and is not revised for weather.
2024 is the exception, and it is the most useful year in the record. Issuance came in at roughly half the 2001 to 2023 average, coinciding with the El Nino drought across the Congo Basin. The programme did not issue against the drought, because it does not issue against a forecast. 2025 is recovering.
Verification cadence
The dashed marks show where a five-year verification cycle would have fallen over the same period, counting from the first vintage. Continuous measurement recorded the 2024 shortfall in the year it occurred.
Figures are issued volumes from the issuance schedule and sum to the total published for this programme. Current-year performance is not shown: partial-year figures do not support a reading of trend, and are discussed under diligence.
2024 issuance was -53 per cent against the 2001 to 2023 mean.
Allocation
Committed before the first sale.
Allocation
A fixed share of every sale, and where it goes.
A fixed share of net sales proceeds from every credit sold goes to four community funds. The share was set before the programme had sold anything, and the four funds were chosen by the communities themselves rather than designed around the programme.
The four funds are drawn from the community's own development plan.
They were not designed around the programme, and the programme does not choose between them. The allocation schedule follows each fund separately, vintage by vintage.
Rural access
Rehabilitation of roads that connect communities and producers to markets.
Agriculture and livelihoods
Silvopastoral practice, food self-sufficiency and steady household income.
Social services
Health, education, clean water, energy and support for vulnerable people.
Environmental protection
Forest stewardship, biodiversity and resilience to climate change.
Allocation
The work and the landscape, on one record.
The record
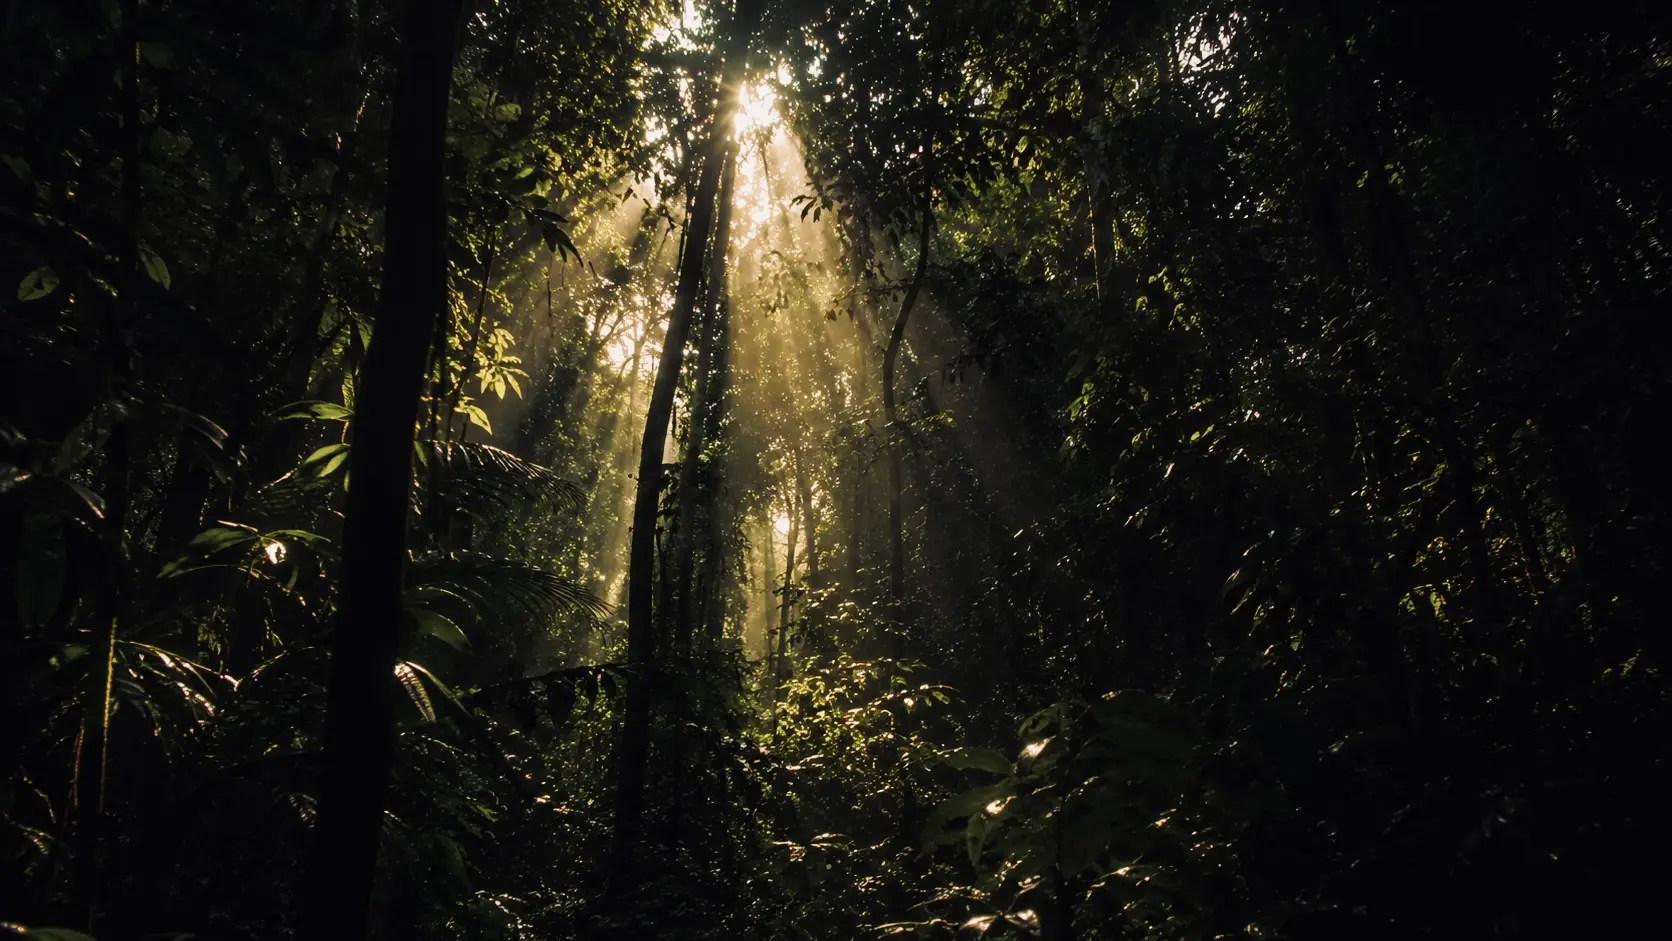
Three of the four funds are monitored against the same satellite measurement record that quantifies the programme's carbon, with quarterly reporting. The fourth, social services, is tracked through financial and investment reporting. The work the funding pays for and the landscape it protects are read from one record.
Each allocation moves through four recorded states: planned, committed, disbursed and implemented, with any difference carried forward line by line. The schedule is built to be audited, and each fund's record runs from the vintage that funded it to the intervention it paid for.
The allocation described here is defined in the programme's project design documentation as a defined share of net sales proceeds, being gross sale proceeds less selling and transaction costs and any operating deductions. The size of the share and its administration are project-specific commercial terms, shared with parties who engage TenTrinity Carbon. Allocations are commitments recorded in the programme's allocation schedule and are not expenditures, and figures remain subject to audit and to disbursement plans agreed with community governance structures. This page is provided for information only and does not constitute an offer, a solicitation, investment advice or a representation as to future outcomes.
Project-specific information, including methodology, volumes, pricing, delivery terms, and the identity of the project and its partners, is shared directly with parties who engage TenTrinity Carbon.
Speak with the team about this project